 Measuring the ground's response to earthquake shaking
Pacific Coastal and Marine Science Center Global Geoengineering Research Modeling Methods of Study
Alaska Australia California China Ecuador Grand Canyon Greece Hawaii Italy Japan New Orleans Taiwan Washington State
Measuring the ground's response to earthquake shaking
Spectral-Analysis-of-Surface-Waves (SASW)
Ground Penetrating Radar (GPR)
Measuring the ground's response to earthquake shakingMeet Velociraptor—USGS' Seismic-Wave Velocity Explorer! Velociraptor measures how much the ground it’s on will shake during an earthquake, and determines whether the ground is likely to liquefy. It does this by measuring ground “stiffness”—the tendency of the ground to resist deforming (changing shape) when subjected to forces like earthquake shaking.
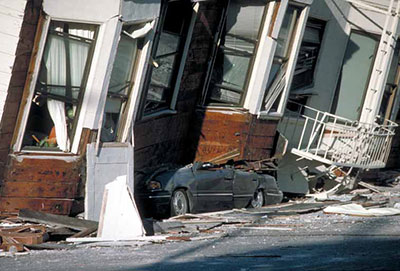
In San Francisco, shaking damage was far more severe in the Marina District than on nearby Nob Hill.
Solid rock has more stiffness—and will shake less—than well-packed sediment, such as ancient stream gravels; and both have more stiffness than loose sand or artificial fill. When the Loma Prieta earthquake struck in 1989, structures on bedrock near the earthquake’s epicenter in the Santa Cruz Mountains shook less, and suffered less damage, than some structures miles away that had been built on young, unconsolidated sediment in downtown Santa Cruz and on artificial fill in parts of San Francisco and Oakland.
To determine how stiff the ground is, Velociraptor measures surface-wave velocity (hence the name “Velociraptor”). A surface wave moves along the ground surface and shakes the ground below. Short waves shake the ground only a little way below the surface, whereas long waves shake the ground from the surface to deep below. Some lucky observers have seen surface waves—which look and act like water waves—undulating the ground during earthquakes.
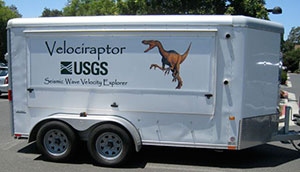
Above, the Velociraptor trailer sits ready to be transported.
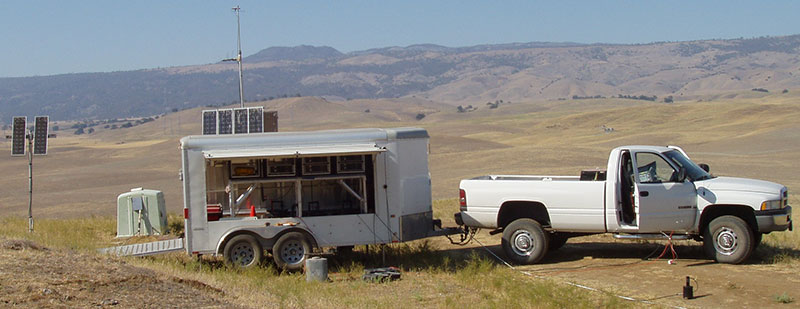
Below, Velociraptor measuring ground stiffness at the Gold Hill sensor array, Parkfield, California, 2008
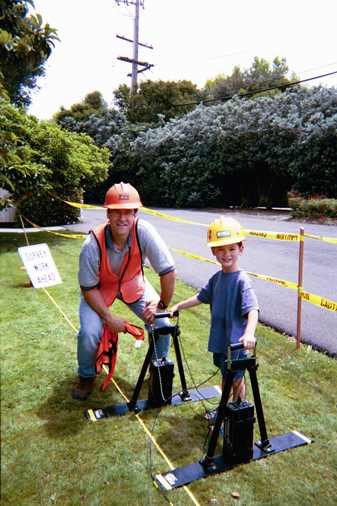
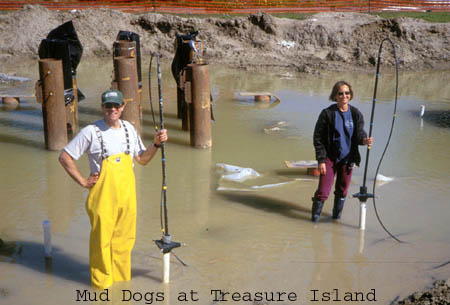
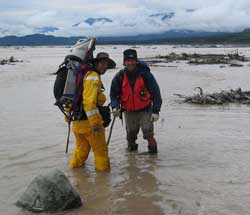 Spectral Analysis of Surface Waves (SASW) methods are a relatively new class of seismic tools useful for evaluating the stiffness characteristics of soil deposits. For our field-testing, we use a variety of passive-signal and active-source tests appropriate for the wide range of environments and site accessibilities at liquefaction sites. Surface wave methods are especially useful for profiling gravelly sand deposits where sampling is difficult and penetration tests fail to accurately quantify soil properties. Surface wave methods are perhaps the most efficient field tests for profiling the near-surface, principally because all measurements are made at ground level with highly portable equipment, the apparatus is non-destructive to the soil, and computed profiles typically yield a highly-detailed shear wave velocity model of the near surface. Unlike drilling and probing methods, SASW apparatus is lightweight, portable, easily deployable by one or two people, and usually requires no permitting. Surface wave apparatus can be deployed at locations impossible to reach by vehicle or truck. To reach many of our most remote locations, we have transported our surface wave test systems by canoe, raft, helicopter, and backpack.
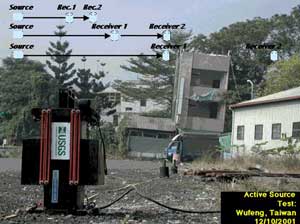 From the active and passive array data, Raleigh-wave phase velocities (dispersion curve) can be computed directly from the cross-power spectrum (SASW method), averaged-coherence (SPAC method), or the wave number associated with the peak of the power spectrum at each frequency step (ƒ-k method). The dispersion curve used to invert the shear wave velocity profile is a plot of either phase-velocity-versus-frequency, or -wavelength. The ability to perform near-real time frequency domain calculations and monitor the progress and quality of the test allows us to adjust various aspects of the data-collection to optimize the capture of these dispersion measurements. These aspects include amplitude of the source-wave generation, frequency-range, frequency step between wave bursts, number of cycles-per-frequency, and the receiver spacing.
Inversion of the experimental dispersion measurements is done using a numerical approach that employs a constrained least squares fit. This inverse problem solves for a model shear wave velocity profile whose theoretical dispersion curve is a least squares “best-fit” with the experimental field data.
See:
Surface wave site characterization at 27 locations near Boston, Massachusetts, including 2 strong-motion stations: U.S. Geological Survey Open-File Report 2014-1232
Seismic Shear Deformation of Compliant Fine-Grained Soil
Surface Wave Investigation and Analysis Earthquake-Induced Liquefaction Sites in Asia
Geotechnical Reconnaissance of the 2002 Denali Fault, Alaska Earthquake
Geotechnical Observations of the November 3, 2002 M7.9 Denali Fault Earthquake
Surface-wave site characterization at 53 strong-motion recording stations affected by the Parkfield, California, M6.0 earthquake of 28 September 2004: U.S. Geological Survey Open-File Report 2010-1168
Shear Wave Velocity of the Ground Near Southern California TRINET Sites Using the Spectral Analysis of Surface Waves Method (SASW) and Parallel-Arrayed Harmonic-Wave Sources: U.S. Geological Survey Open-File Report 2005-1365
Shear Wave Velocity of the Ground Near Sixty California Strong Motion Recording Sites by the Spectral Analysis of Surface Waves (SASW) Method and Harmonic-Wave Sources: U.S. Geological Survey Open-File Report 2005-1366
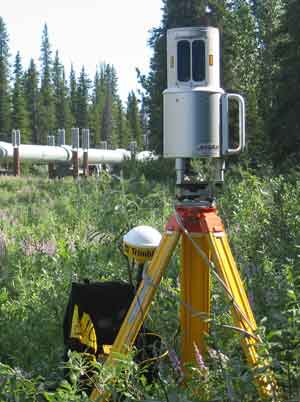
3D Laser Scanning is used to essentially bring the field area home with you. It provides large point datasets to be studied, modelled and manipulated to observe minute changes in the study area.
The laser scanner, along with I-Site 3D Laser Imaging software, was used as part of a doctoral thesis by Brian Collins at the University of California, Berkeley Engineering Department to study coastal bluff failures of a ~2 km site along the Pacifica, California coastline. Funded by the U. S. Geological Survey, Coastal and Marine Geology Program, this study is part of a comprehensive study of landslides along the Pacific coastline. For more details of this study, click here to download the PDF "Bluff Movement Study by University of California" from the I-Site Studio web site.
See:
Use of LiDAR in Post Earthquake Reconnaissance Examples from the Niigata Ken Chuetsu Earthquake
Ground-LiDAR Reconnaissance of the Niigata Ken Chuetsu Earthquake
Applicability of Terrestrial LIDAR Scanning for Scientific Studies in Grand Canyon National Park, Arizona: U.S. Geological Survey Open-File Report 2006-1198
Topographic Change Detection at Select Archeological Sites in Grand Canyon National Park, Arizona, 2006–2007: U.S. Geological Survey Scientific Investigations Report 2009-5116
Ground penetrating radar (GPR) uses radio waves in the range of 1-1000 MHz, to map the internal structure of the ground. GPR antennas are used to transmit electromagnetic waves (EM) into the ground. The EM beam spreads out in a cone-shape, interacting with the material below the ground surface. Depending on the type of GPR we use, EM waves are reflected, refracted, or directly transmitted to a receiving antenna. The properties of the ground affect the speed of radar and attenuation of the EM signal, and these, in turn, non-invasively indicate what type of soil we are imaging.
The most common and simplest mode of GPR operation is single-fold, fixed-offset reflection profiling. In a reflection survey, antennas are transported along a survey line to map reflections. The antennas are placed on the ground at a fixed distance apart and the transmitter sends pulses of radio waves at fixed intervals into the study medium. These signals are reflected back to the receiver off radar impedance interfaces within the soil. As the antenna are moved across the ground and multiple shots are recorded, the resulting radar image has the appearance of a traditional acoustic seismic reflection profile.
See:
Radar Structure of Earthquake-Induced, Coastal Landslides in Anchorage, Alaska
The internal structure of sand bars on the Colorado River, Grand Canyon, as determined by ground-penetrating radar: U.S. Geological Survey Open-File Report 2001-425
Crosshole GPR is used to determine the in situ properties of the ground. The acquisition methods and processing requirements are very different from reflection surveys. Rather than measuring the two-way travel time of energy bounced off a buried feature, a crosshole survey is a transillumination survey. Here, radar signals are transmitted directly through the medium between two boreholes. After radar traces are gathered between the two boreholes tomograrphy methods are used to estimate the radar velocity structure of the ground. For saturated sediment, radar velocity relates to soil density and allows us to map 2 dimensional images of density structure of the ground.
See:
Investigations of the coastal zone, lake floor, and seafloor by the USGS involve the sampling of soil retained in metal or plastic liners. Soil samples are taken by the USGS to address topics such as assessment of liquefaction and landsliding during earthquakes, identification of regions of the seafloor contaminated by human activities, understanding the history of sedimentation and climate change preserved in the sediment record, and evaluation of mineral resource potential. For carefully sampled and stored sediment, intrinsic sediment properties (e.g., grain size) generally remain unchanged after sampling, whereas, sediment state properties can be highly susceptible to change. State properties include those altered by volumetric changes in pore water, or by accumulated strain (e.g., density, velocity, strength, and their related moduli). Even for carefully sampled soil, state properties can be significantly altered during storage, transportation, extrusion and laboratory testing.
To best estimate the in-place properties of soil we nondestructively measure the state properties by use of two custom designed and built logging devices that scan sediment cores through intact liner. Our device measures three soil properties
soil wet bulk-density by Lambert attenuation of gamma ray radiation; and
sediment magnetic susceptibility.
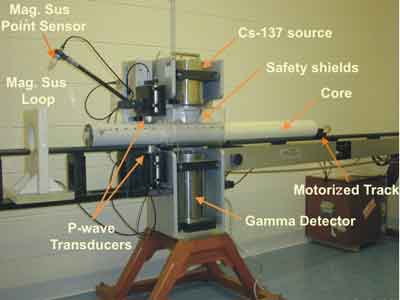
One of the two devices we use is the first multi-sensor whole core sediment-logging device built in Great Britain by Geoteck, Ltd. Sealed cylindrical sediment cores are placed horizontally upon a transport sled and moved by a computer-controlled stepper motor through a frame supporting three sensors. In a sequence, the logging device measures core diameter and p-wave travel time to compute p-wave velocity, attenuation of gamma rays from a 137Cs source to compute soil wet bulk density; and magnetic susceptibility of soil particles via a magnetic field hoop. Measurements of velocity, density, and magnetic susceptibility are typically taken at 1-centimeter increments, often within the first hour after the cores are sampled. The transport sled is capable of carrying individual core sections up to 1.5 meters in length.
Read more information about the operation of the Core Logger
Also see:Settlement of the USS Arizona, Pearl Harbor, Hawaii: U.S. Geological Survey Scientific Investigations Report 2013-5096
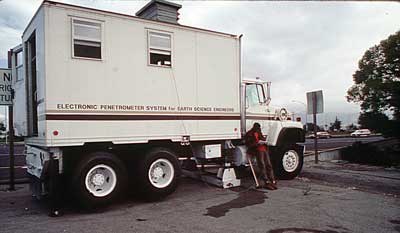
Standard Penetration Tests (SPT) and Cone Penetration Tests (CPT) are used to map soil stratigraphy and to make quantitative evaluations of a soil's resistance to liquefaction. Both are destructive in situ tests and commonly are used together. At Coastal and Marine Geology we contract these standardized and routine services.
See:
Physical Properties:
Grain Size
Tc/Toc/Tic (Carbon)
Specific Gravity
Water Content/Void Ratio/Porosity/Density
Multi-Sensor Logger (Density/P-Wave Velocity/Magnetic
Permeability
Stress History:
Constant-Rate of Strain Consolidation (CRS) Test
Maximum Past Stress
Consolidation State
Compressibility
Shear Strength:
Laboratory Vane
Unconfined Compression
Triaxial (Undrained Shear)
Triaxial (Drained Shear)
Determined Peak and Residual Strength
For in-depth information about Multibeam-mapping technology please see:
Pacific Seafloor Mapping Project: Mapping history and technology
Multibeam Data and Socio-Economic Issues in West-Central San Francisco Bay
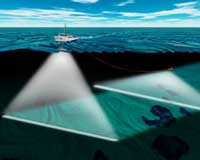
Sidescan Sonar is a survey method used in underwater geology which provides the broadest view of the sea-floor. An acoustic emitter is towed behind a vessel and sends out sound waves in a fan-shaped beam. These pulses of sonic energy are reflected back to a transducer—return time depending on distance traveled—and recorded on a rotating drum.
See: Sea-Floor Mapping: Data Acquisition
 Back to Top