Plots of the data coverage. Click on figure for larger image in PDF format.
|
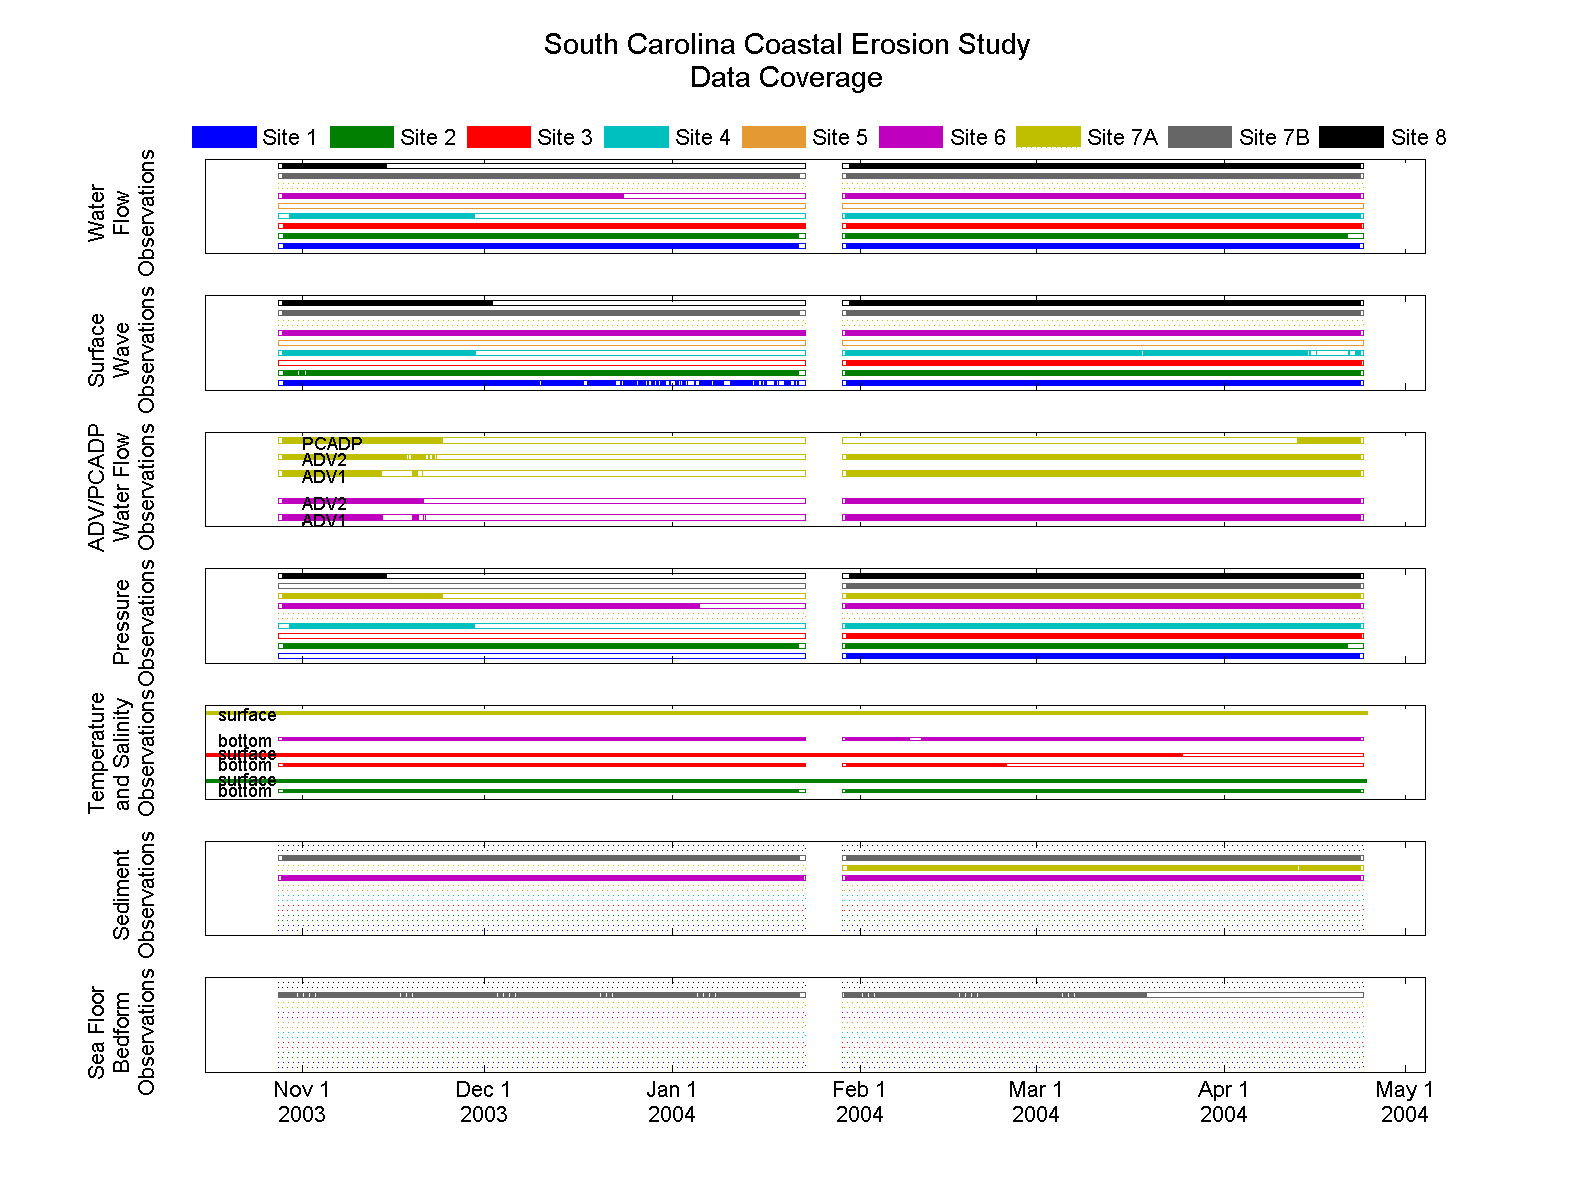
Data included in this report were collected at nine sites between October 2003 and April 2004. The data include water flow, sea level, conductivity, temperature, wave characteristics, near-bottom turbulence, suspended sediment concentrations, and sea floor bedforms (ripples). The instrument turnaround in late January 2004 resulted in an approximate 1-week gap in the data series. Instrument malfunctions, biological or mechanical fouling, and accidental disruption of the instrumentation caused shorter gaps in the time-series data. In some instances, instruments did not record certain data due to errors in programming of the instrument. At Site 5, significant tilt of the data resulted in complete loss of the data there.
Plots of the data coverage (pdf format and png format) have been compiled for the entire deployment period. For each parameter measured, the figures show bars, colored by site, to indicate data availability and quality. Bars with solid outlines indicate that data was collected. These bars are filled where data is of good quality, and are empty where it was removed. In the digital data files, questionable data has been flagged with a fill value.


|
