
The December 26, 2004 Indian Ocean Tsunami: Initial Findings on Tsunami Sand Deposits, Damage, and Inundation in Sri Lanka
Survey and Methods
Scientists on the Sri Lanka ITST recorded eyewitness accounts and made measurements at more than 30 locations in Sri Lanka (see map below). Measurements included tsunami water level, run-up elevation, inundation distance, tsunami flow direction, topographic profile, erosion depths, and tsunami sand deposit thickness and characteristics.
Samples of tsunami sands were collected for laboratory analyses for grain size distribution, microfossil content, mineralogy, and chemistry. Sedimentary characteristics of the tsunami deposits and underlying material were logged and photo-documented. Box cores and pipe cores were taken at several sites to preserve the stratigraphy of the sediments.
Locations of sites where the
Sri Lanka ITST made measurements of the tsunami.
 Interviewing eyewitnesses was an important part of our work. Eyewitness reports give information about the number of waves in the tsunami, their size, and when they arrived at the coast. The combination of eyewitness reports, water level measurements, and interpretation of tsunami sand deposits give a more complete picture of the tsunami than relying on just one of these data types. (larger image, 107 kb) |
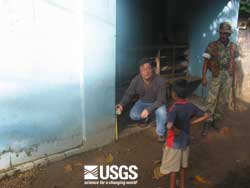 Measuring the level of the water mark on this building, located approximately 500 m inland at Kulmunai. Water level measurements give valuable information about how the tsunami lost energy as it moved across land. (larger image, 83 kb) |
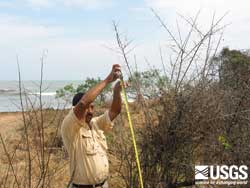 Debris brought onshore by the tsunami and caught in bushes indicate the height of the tsunami. (larger image, 158 kb) |
 Simple, durable field tools, such as a hand level and tape, are used to survey topographic profiles and to measure heights of water marks above sea level. (larger image, 96 kb) |
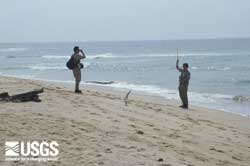
 Surveying topography at Ibral Nagar Nalalevi using a hand level. The vertical datum for the surveys was sea level at the time of the survey. This datum was corrected once back in the office to both a tidal datum and sea level at the time the tsunami hit Sri Lanka. (larger image, 91 kb) |
 Preparing a trench before taking sediment samples for grain-size analysis, microfossil content, mineralogy, and chemistry. Photograph courtesy of Bretwood Higman, University of Washington. (larger image, 119 kb) |
 Both domestic and wild animals were seen evacuating to higher ground long before the tsunami arrived on the south coast of Sri Lanka. This wild elephant was photographed while taking measurements of the tsunami at Yala. (larger image, 156 kb) |
 Taking sediment samples for grain-size analysis, microfossil content, mineralogy, and chemistry. Laboratory analyses of the samples, in conjunction with modeling, give information about where the tsunami brought the sand from and flow during the tsunami. (larger image, 142 kb) |
 Inundation Distances and Run-up Elevations
 |
 |
 |
 |