The December 26, 2004 Indian Ocean Tsunami: Initial Findings on Tsunami Sand Deposits, Damage, and Inundation in Sri Lanka
Tsunami Sand Deposits
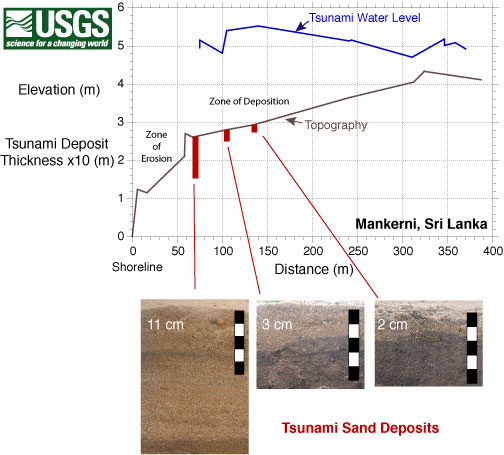
The tsunami in Sri Lanka carried sand from the beach and ocean floor and deposited it in buildings, on top of boulders, and on the ground. Tsunami sand deposits were found at all sites that the East and South Sri Lanka Teams visited. Although tsunamis are capable of eroding the land, erosion in Sri Lanka was often concentrated in a relatively narrow zone near the coast. For example, at Mankerni, there was evidence that a grassy area eroded about 1 meter in the vertical in a zone about 20 to 30 meters wide near the coast. The sand eroded was transported both onshore and offshore. The sand transported onshore formed a recognizable tsunami sand deposit. Tsunami sand deposits at Mankerni started about 50 meters inland, and decreased in thickness from about 10 centimeter total thickness to about 2 cm thickness at about 150 meters inland. In other locations where the tsunami was larger, both the width of the erosion zone and the tsunami deposit were larger.

Although the tsunami receded long before the ITST arrived in Sri Lanka, the sand that remained can tell us much about the tsunami. The tsunami sand deposits often contained two or more layers. These layers were formed by different tsunami waves and by variations in flow within a wave. Analysis of the sand samples collected will add information that the Sri Lanka ITST was not able to collect about the tsunami. For example, from lab analyses and computer modeling of the tsunami sand deposits, we will be able to estimate the speed (flow velocity) of the tsunami as it moved inland.
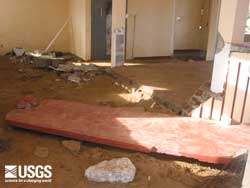
 Sand and debris transported by the tsunami into the Post Office at Kalmunai. Outside the Post Office, there was localized erosion nearby and thick (>10 cm) sand deposits. (larger image, 123 kb) |
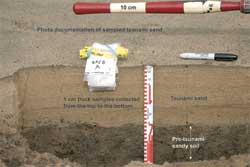
 Tsunami sand deposit at Nalaveli Hotel. The sand deposited by the tsunami is light colored and overlies a pre-tsunami darker sandy soil. This tsunami deposit is approximately 15 cm thick and composed of three thick layers defined by darker areas (heavy mineral layers) and sub-layers that are visible near the surface. Grain size analysis in the lab will be used to determine whether the deposit was formed by three or more waves. A numerical model (Jaffe and Gelfenbaum, 2002) will be run using the field and lab data to estimate tsunami flow velocity at this location. Figure courtesy of Bretwood Higman, University of Washington. (larger image, 171 kb) |
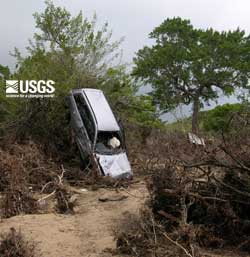
 The tsunami had the ability to transport large particles (a car), but, because primarily sand was available to be transported, almost all tsunami deposits are composed of sand. (larger image, 292 kb) |
 Erosion of grassy area approximately 40 m inland at Mankerni. Tsunami sand deposits were 10 cm thick 20 m inland of where this photograph was taken. The transition from erosion to deposition was at about 50 m inland. (larger image, 163 kb) |
 |
 |
 |
 |

 Recovery and Planning